
In this article I will show how to build a Covid-19 Vaccination dashboard from the ground up using Django and Chart.js. We're going to use a dataset from Kaggle, which you can find here.
This article is part one of a series. Here is a list of the articles and what they cover:
- Part 1: (this article) Setup, data model and data import, Chart.js integration, API endpoint and async data fetching
- Part 2: Pie chart, styling with Tailwind CSS, data grid with Grid.js
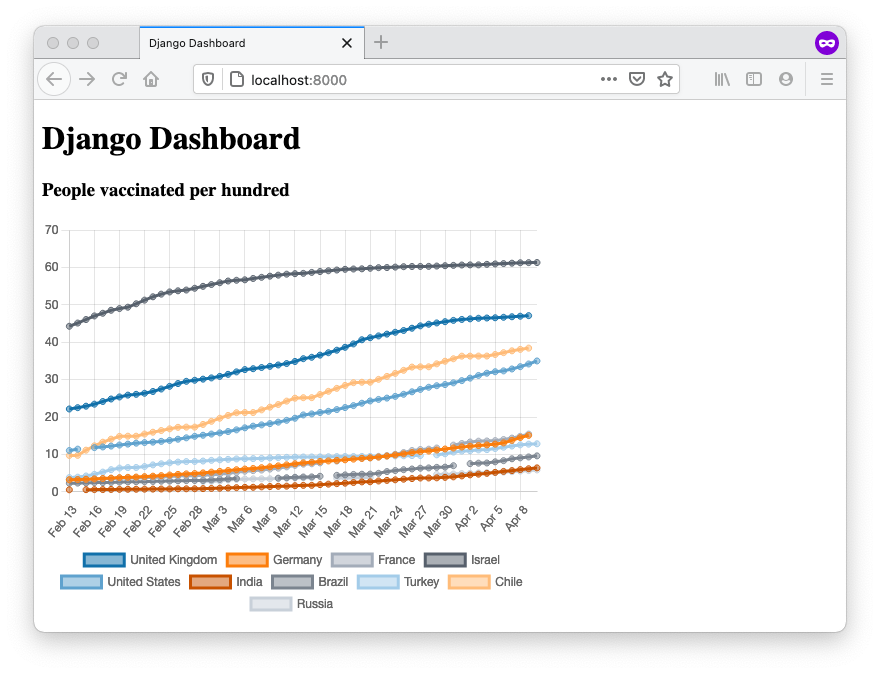
Here is how the final application will look like:

Note: If you're planning to build a complex dashboard app with lots of dynamic user interaction like filtering etc., you'll probably want go for a frontend framework like React or Vue. However, if you just want to display a few charts to visualize mostly static data and don't have a need for a lot of user interaction, using Django and a little bit of plain JavaScript gets you quite a long way. And of course you can switch to using a frontend framework later and still use your Django app as the backend!
You should already have some familiarity with Django and JavaScript to follow along this article. Check out my other article for some resources of how to get started with Django and web development.
The full code for this article is available on Github.
Setup
As usual, create a new project directory and virtual environment, activate the environment, install Django and start a new Django project.
$ mkdir django-vaccine-dashboard
$ cd django-vaccine-dashboard
$ python3 -m venv venv
$ source venv/bin/activate    (on Mac)
$ venv/Source/activate        (on Windows)
(venv) $ pip install --upgrade pip
(venv) $ pip install Django~=3.2.0
(venv) $ django-admin startproject config .
Create a new app dashboard in your Django project and register it in the project settings.
(venv) $ python manage.py startapp dashboard
# config/settings.py
INSTALLED_APPS = [
    ...
    'dashboard',
]
To make sure everything works until that point, start the development server and go to http://127.0.0.1:8000 in your browser.
(venv) $ python manage.py runserver
You should see the familiar welcome page with the rocket taking off.
Data Model
Before we continue you will need to download the dataset from Kaggle. Download and unpack the archive and copy to file country_vaccinations.csv into a subdirectory data/ in your project folder.
The zip-archive also contains another dataset which contains more detailed data about the vaccines used from different manufacturers. Although this dataset could be used for the dashboard as well, I will not do this here for the sake of brevity.
Open the file in a text editor. You will see that each row contains vaccination data for one country on a particular date in CSV format.
| country | iso_code | date | total_vaccinations | people_vaccinated | people_fully_vaccinated | daily_vaccinations_raw | daily_vaccinations | total_vaccinations_per_hundred | people_vaccinated_per_hundred | people_fully_vaccinated_per_hundred | daily_vaccinations_per_million | vaccines | source_name | source_website |
|---|---|---|---|---|---|---|---|---|---|---|---|---|---|---|
| Belgium | BEL | 2020-12-28 | 298.0 | 298.0 | 0.0 | 0.0 | Moderna, Oxford/AstraZeneca, Pfizer/BioNTech | Sciensano | https://epistat.wiv-isp.be/covid/ | |||||
| Belgium | BEL | 2020-12-29 | 299.0 | 299.0 | 1.0 | 1.0 | 0.0 | 0.0 | 0.0 | Moderna, Oxford/AstraZeneca, Pfizer/BioNTech | Sciensano | https://epistat.wiv-isp.be/covid/ | ||
| Belgium | BEL | 2020-12-30 | 777.0 | 777.0 | 478.0 | 240.0 | 0.01 | 0.01 | 21.0 | Moderna, Oxford/AstraZeneca, Pfizer/BioNTech | Sciensano | https://epistat.wiv-isp.be/covid/ |
As with any other application, you'll need to decide how to model the data in your database. For the current usecase, two approaches make sense to me: 1) Storing all the data in a single model. 2) Storing the data in two separate models, one for countries and another for vaccine data entries. Each entry would be linked to a country through a foreign key (many-to-one relationship).
I'll go for the first option, because it save us a bit of data preparation at the beginning and we'll still be able later to get the data for individual countries by filtering with the Django ORM.
In the dashboard directory, edit the models.py file. You can simply use the column headers as field names. For each field choose the appropriate field type from the Django Model fields.
# dashboard/model.py
from django.db import models

class Entry(models.Model):
    country = models.CharField(max_length=200)
    iso_code = models.CharField(max_length=3, null=True, blank=True)
    date = models.DateField()
    total_vaccinations = models.IntegerField(null=True, blank=True)
    people_vaccinated = models.IntegerField(null=True, blank=True)
    people_fully_vaccinated = models.IntegerField(null=True, blank=True)
    daily_vaccinations_raw = models.IntegerField(null=True, blank=True)
    daily_vaccinations = models.IntegerField(null=True, blank=True)
    total_vaccinations_per_hundred = models.FloatField(null=True, blank=True)
    people_vaccinated_per_hundred = models.FloatField(null=True, blank=True)
    people_fully_vaccinated_per_hundred = models.FloatField(null=True, blank=True)
    daily_vaccinations_per_million = models.IntegerField(null=True, blank=True)
    vaccines = models.CharField(max_length=200, null=True, blank=True)
    source_name = models.CharField(max_length=200, null=True, blank=True)
    source_website = models.CharField(max_length=200, null=True, blank=True)

    def __str__(self):
        return f"{self.country} {self.date}"

    class Meta:
        verbose_name_plural = "entries"
Except for country and date, the model fields are allowed to accept null as value by specifying null=True, blank=True, as the dataset not always provides values for each field. The __str__ method will return the country name and date for each entry. The grammatically correct plural of the model name is specified with the verbose_name_plural property in the Meta class.
Update the database with the new model definition.
(venv) $ python manage.py makemigrations dashboard
(venv) $ python manage.py migrate
You can add model to the Django admin like this.
# dashboard/admin.py
from django.contrib import admin
from .models import Entry

class EntryAdmin(admin.ModelAdmin):
    list_display = ["country", "date", "total_vaccinations", "total_vaccinations_per_hundred"]

admin.site.register(Entry, EntryAdmin)
Create a superuser and start the dev server. You will see the new model appear in the Django admin at http://127.0.0.1:8000/admin.
(venv) $ python manage.py createsuperuser
(venv) $ python manage.py runserver

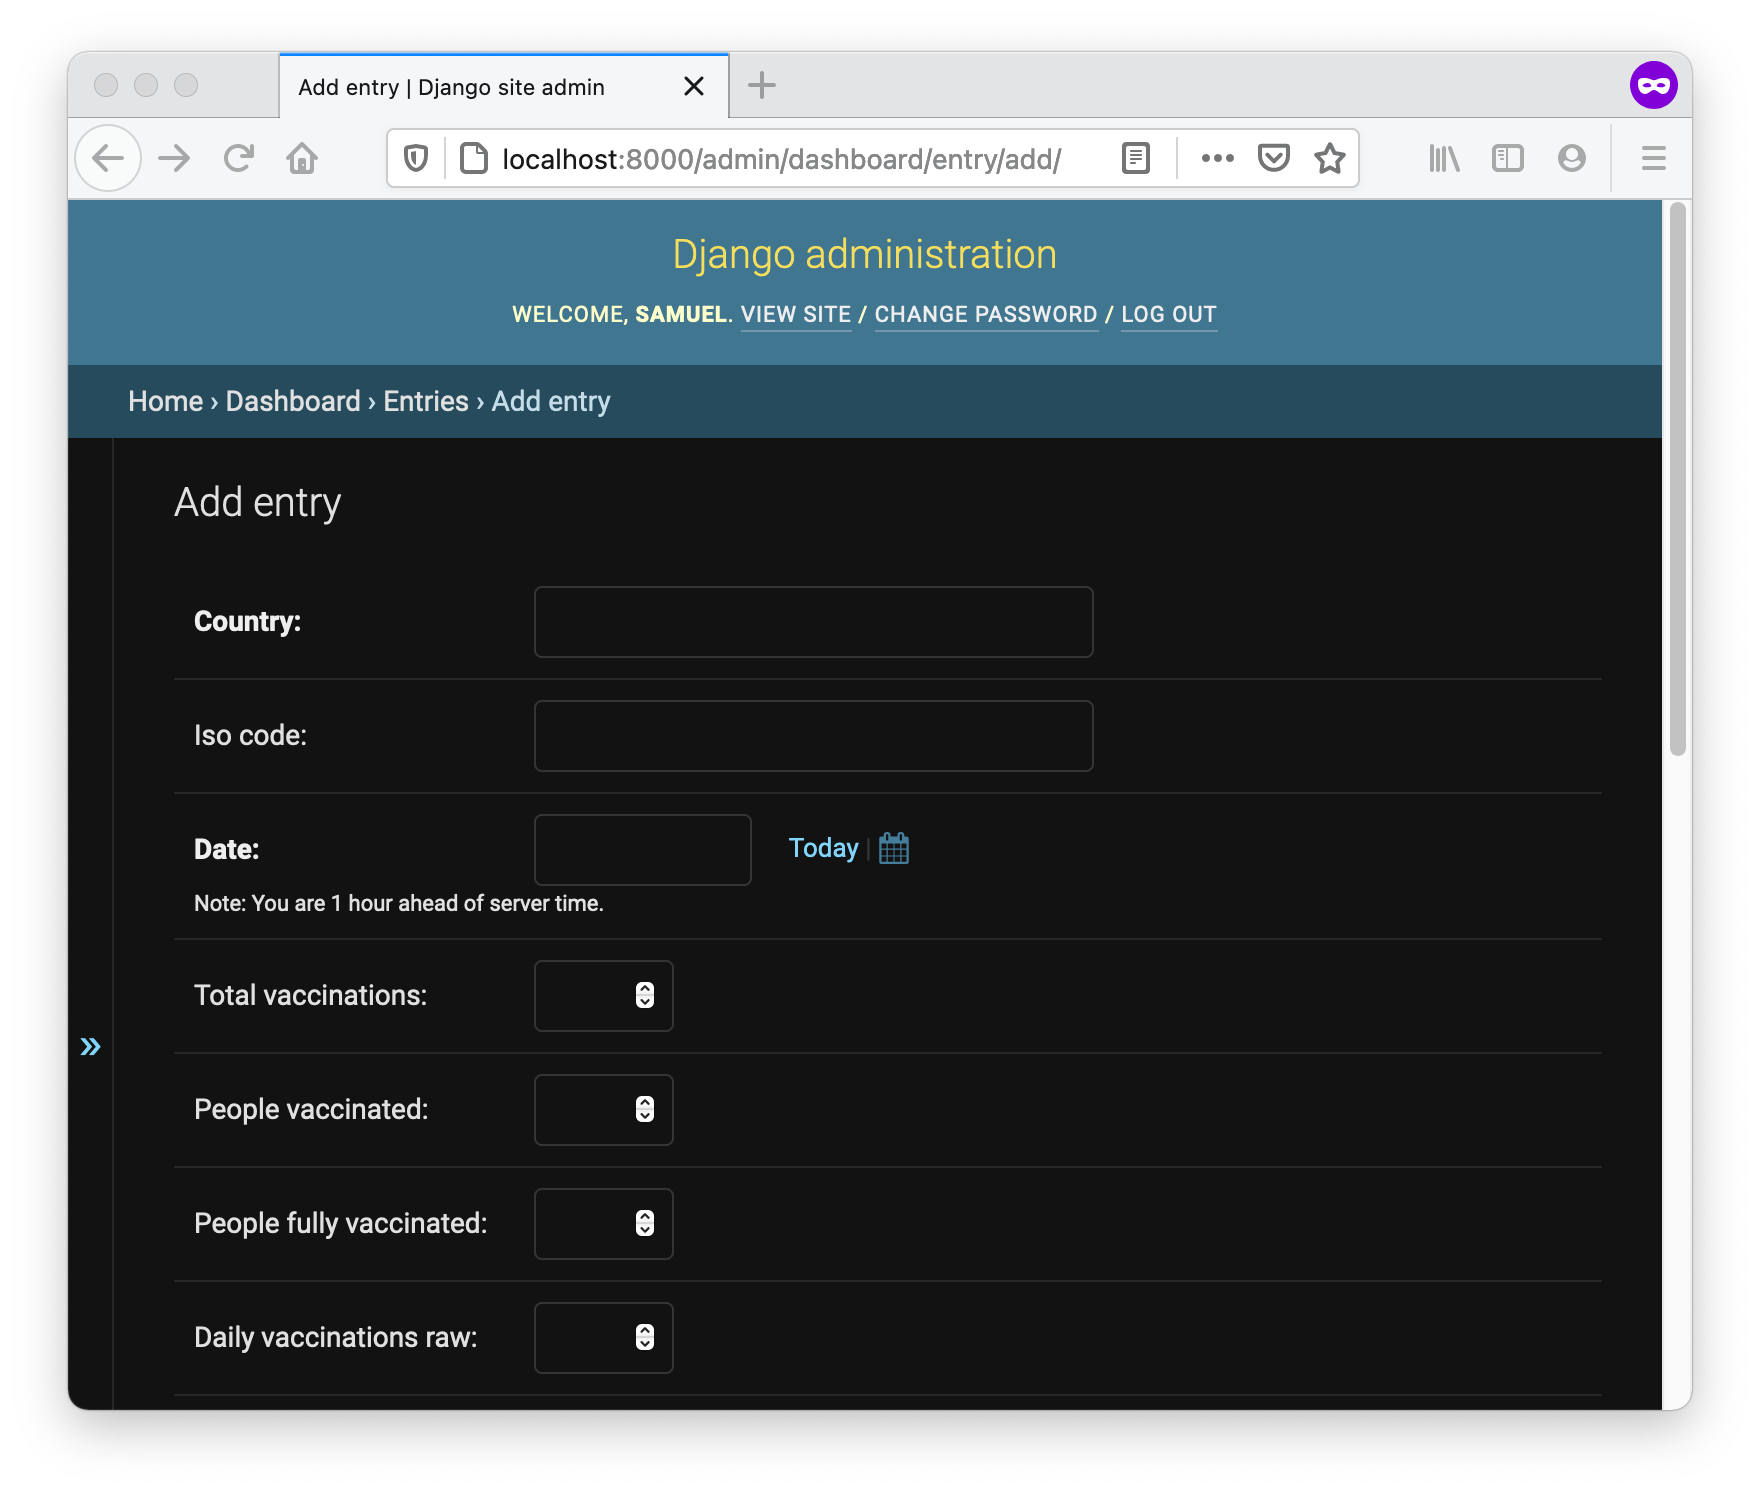
Click the add button next to Entries. You will see a form to create a new Entry in the database with all the fields that we specified.
Now that you've defined the data model and set-up the Django Admin, it's time to think about how to import the data.
Custom command to import data
One way to import the data would be to open a Django shell python manage.py shell and write a few lines of code that parse the csv file, create the Entry objects and write them to the database.
However it would be very tedious to do this each time new data is available, which in the case of Covid vaccination data is ... every day! Therefore it would make sense to create a custom django-admin command. This command can be easily run from the command line or even be set up as a scheduled job and run periodically.
Note: In the latter case it would make sense to have the command download the dataset automatically. However, we're not going to do that here.
Create a custom setting at the bottom of your settings.py, so that the command will know where to find the data source.
# config/settings.py
...
ENTRIES_DATAFILE = BASE_DIR / "data/country_vaccinations.csv"
In order to create the custom command, create a management/commands directory within your dashboard app directory. Django will register a custom command for each file in this directory that does not begin with an underscore _.
# dashboard/management/commands/seed.py
import csv, json

from django.core.management.base import BaseCommand, CommandError
from config.settings import ENTRIES_DATAFILE

class Command(BaseCommand):
    help = 'Seed the database with vaccination data'

    def handle(self, *args, **kwargs):
        try:
            with open(ENTRIES_DATAFILE, 'r') as fp:
                reader = csv.DictReader(fp)
                for i, row in enumerate(reader):
                    self.stdout.write(json.dumps(row))
                    if i > 1: break
        except FileNotFoundError:
            raise CommandError(f'File "{ENTRIES_DATAFILE}" does not exist')
At the moment the command is not writing anything to the database yet. It just prints the first three rows of the dataset in JSON format to stdout. It is good practice to use self.stdout.write() instead of print for testing purposes of custom commands.
Now you can run your custom command like any of the other Django management commands.
(venv) $ python manage.py seed
{"country": "Afghanistan", "iso_code": "AFG", "date": "2021-02-22", "total_vaccinations": "0.0", "people_vaccinated": "0.0", "people_fully_vaccinated": "", "daily_vaccinations_raw": "", "daily_vaccinations": "", "total_vaccinations_per_hundred": "0.0", "people_vaccinated_per_hundred": "0.0", "people_fully_vaccinated_per_hundred": "", "daily_vaccinations_per_million": "", "vaccines": "Oxford/AstraZeneca", "source_name": "Government of Afghanistan", "source_website": "http://www.xinhuanet.com/english/asiapacific/2021-04/07/c_139864755.htm"}
...
Great, that works. However, there is one problem. As you can see, all the numerical data is formatted as a string. We'll have to convert the numerical data to the appropriate types (i.e. integers and floats) before we feed it into the database.
One way to do that would be to write a function that tries to convert a string into a float or integer. I am not sure if that is the most elegant way to do this, but it worked for me. If you have a better idea, let me know in the comments!
Create another file _utils.py next to the seed.py with the following content.
# dashboard/management/commands/_utils.py
def convert(arg_in):
    """convert to float or int if possible, return string otherwise"""
    if not arg_in:
        return None
    try:
        arg_float = float(arg_in)
        arg_int = int(arg_float)
        if arg_int == arg_float:
            return arg_int
        else:
            return arg_float
    except:
        return arg_in

if __name__ == "__main__":
    assert convert('') == None
    assert convert('1') == 1
    assert convert('1.0') == 1
    assert convert('1.2') == 1.2
    assert convert('asdf') == 'asdf'
You can execute the file as a python script with python dashboard/management/commands/_utils.py to see if you get any assertion errors. If you don't, everything should work as expected.
With the help of this utility function you can now rewrite seed.py as follows.
# dashboard/management/commands/seed.py
import csv

from django.core.management.base import BaseCommand, CommandError
from dashboard.models import Entry  # new
from config.settings import ENTRIES_DATAFILE

from ._utils import convert  # new

class Command(BaseCommand):
    help = 'Seed the database with vaccination data'

    def handle(self, *args, **kwargs):
        try:
            with open(ENTRIES_DATAFILE, 'r') as fp:
                reader = csv.DictReader(fp)
                for i, row in enumerate(reader):
                    entry = Entry()  #new
                    for k, v in row.items():
                        try:
                            value = convert(v)
                            setattr(entry, k, value)
                        except Exception as e:
                            self.stdout.write(self.style.ERROR(e))
                    try:
                        entry.save()
                    except Exception as e:
                        self.stdout.write(self.style.ERROR(e))
        except FileNotFoundError:
            raise CommandError(f'File "{ENTRIES_DATAFILE}" does not exist')

        self.stdout.write(self.style.SUCCESS('Successfully seeded database.'))
Because the columns headers of our dataset are exactly identical to the field names of our model, we can simply iterate over the items of each row and set the fields of the new Entry object after trying to convert the value to numeric.
Run the command again and it will import all the data into the database.
(venv) $ python manage.py seed
Successfully seeded database.
As a quick test, we can now get the list of distinct country names in the Django shell.
(venv) $ python manage.py shell
from dashboard.models import Entry
countries = Entry.objects.values_list('country').distinct()
countries
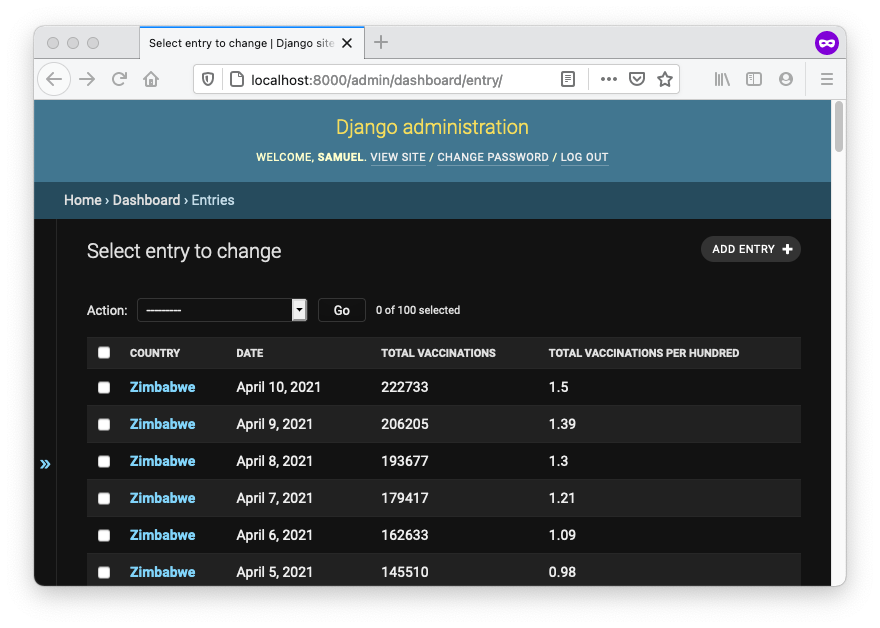
# That looks great! Now head over to the Django Admin and have a look at the list of Entries.
Template and View
Now that the data is in place, you can you can head over and create a template and a view that for our dashboard.
I usually like to store my templates in a separate templates directory in the project root directory. Create the directory and add it to your settings.
# config/settings.py
TEMPLATES = [
    {
        'DIRS': [BASE_DIR / 'templates'],
        ...
]
Create a base template base.html and another template home.html that extends the base.
<html lang="en">
  <head>
    <meta charset="UTF-8" />
    <meta http-equiv="X-UA-Compatible" content="IE=edge" />
    <meta name="viewport" content="width=device-width, initial-scale=1.0" />
    <title>Django Dashboardtitle>
  head>
  <body>
    {% block content %} {% endblock %}
  body>
html>
{% extends 'base.html' %}
{% block content %}
<h1>Django Dashboardh1>
{% endblock %}
Create a home view to render the template and register it to the urls.py.
# dashboard/views.py
from django.shortcuts import render

def home(request):
    return render(request, template_name='home.html')
# dashboard/urls.py
from django.urls import path
from . import views

urlpatterns = [
    path('', views.home, name='home')
]
Lastly, include the urls dashboard.urls in your project level urls.
# config/urls.py
from django.urls import path, include  # new

urlpatterns = [
    path('admin/', admin.site.urls),
    path('', include('dashboard.urls')),  # new
]
Head over to '127.0.0.1:8000' in your web browser.
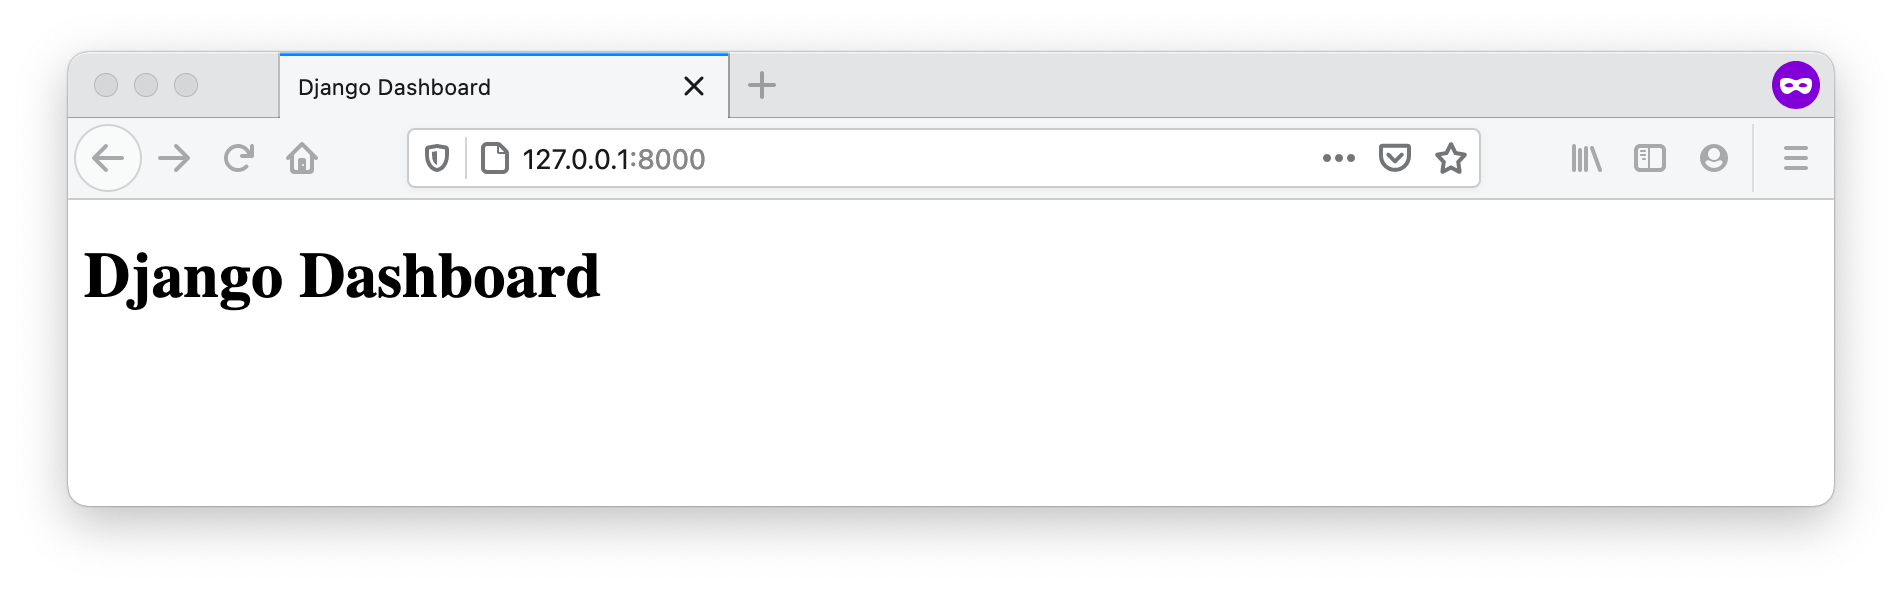
Well, that's not very exiting. So let's continue and put a chart on the page.
Chart.js integration
The easiest way to integrate the Chart.js library into our Django app is to load it from a CDN service. You can find the links on the Chart.js Installation Guide. Copy the script tag from here and paste it into the home.html template just above the {% endblock %}.
Before we actually fetch some data from our database and show it in a chart, let's display a chart with some dummy data in our template, just to get an idea of how it works. You can use the example from the Chart.js Introduction.
Paste the example code into your template so that it looks like this.
# templates/home.html
{% extends 'base.html' %}
{% block content %}
<h1>Django Dashboardh1>

<div style="height: 300px; width: 400px;">
  <canvas id="myChart">canvas>
div>

<script
  src="https://cdnjs.cloudflare.com/ajax/libs/Chart.js/3.1.0/chart.min.js"
  integrity="sha512-RGbSeD/jDcZBWNsI1VCvdjcDULuSfWTtIva2ek5FtteXeSjLfXac4kqkDRHVGf1TwsXCAqPTF7/EYITD0/CTqw=="
  crossorigin="anonymous"
>script>
<script>
  var ctx = document.getElementById("myChart").getContext("2d");
  var myChart = new Chart(ctx, {
    type: "bar",
    data: {
      labels: ["Red", "Blue", "Yellow", "Green", "Purple", "Orange"],
      datasets: [
        {
          label: "# of Votes",
          data: [12, 19, 3, 5, 2, 3],
          backgroundColor: [
            "rgba(255, 99, 132, 0.2)",
            "rgba(54, 162, 235, 0.2)",
            "rgba(255, 206, 86, 0.2)",
            "rgba(75, 192, 192, 0.2)",
            "rgba(153, 102, 255, 0.2)",
            "rgba(255, 159, 64, 0.2)",
          ],
          borderColor: [
            "rgba(255, 99, 132, 1)",
            "rgba(54, 162, 235, 1)",
            "rgba(255, 206, 86, 1)",
            "rgba(75, 192, 192, 1)",
            "rgba(153, 102, 255, 1)",
            "rgba(255, 159, 64, 1)",
          ],
          borderWidth: 1,
        },
      ],
    },
    options: {
      scales: {
        yAxes: [
          {
            ticks: {
              beginAtZero: true,
            },
          },
        ],
      },
      responsive: true,
      maintainAspectRatio: false,
    },
  });
script>
{% endblock %}
The element is wrapped in a separate div with a specified size. In the options of the Chart responsive is set to true and maintainAspectRatio to false, so that the chart always fills out the parent element.
Refresh the page and it should now look like this.

Nice! Now the app starts looking a bit more like a dashboard.
Data endpoint
Let's build the first chart, which will display the percentage of vaccinated people over time for different countries.
One way to get the data into the template and display it in the chart would be to pass it as context to the render function (see this blogpost on how to do that).
However, for a data heavy application this is probably not the best approach. The server would first need to execute all the SQL queries, then render the data in the template and finally send the response to back to the client, which could take a significant amount of time.
A better approach, and the one we'll choose, would be to have a separate endpoint (a Django view) that returns just the data. The template contains a bit of Javascript which will be executed on the client to fetch the data asynchronously.
In order to write the data endpoint, you'll need to know the format of the data you want to return. You can find the info you need on the Chart.js docs. Chart.js can be configured to use the x-axis as time scale, which allows you to provide the vaccination data as pairs of x and y for each dataset. That way, Chart.js will parse the dates and we don't have to take care of missing values.
import datetime
from django.http import JsonResponse
from .models import Entry

...

def linechart(request):
    countries=["United Kingdom", "Germany", "France", "Israel", "United States", "India", "Brazil", "Turkey", "Chile", "Russia"]
    cutoff_date = datetime.datetime.today() - datetime.timedelta(days=60)
    datasets = []
    for country in countries:
        qs = Entry.objects.filter(country=country, date__gte=cutoff_date)
        data = [{'x': entry.date, 'y': entry.people_vaccinated_per_hundred} for entry in qs]
        datasets.append({'label': country, 'data': data})
    return JsonResponse(data={'datasets': datasets})
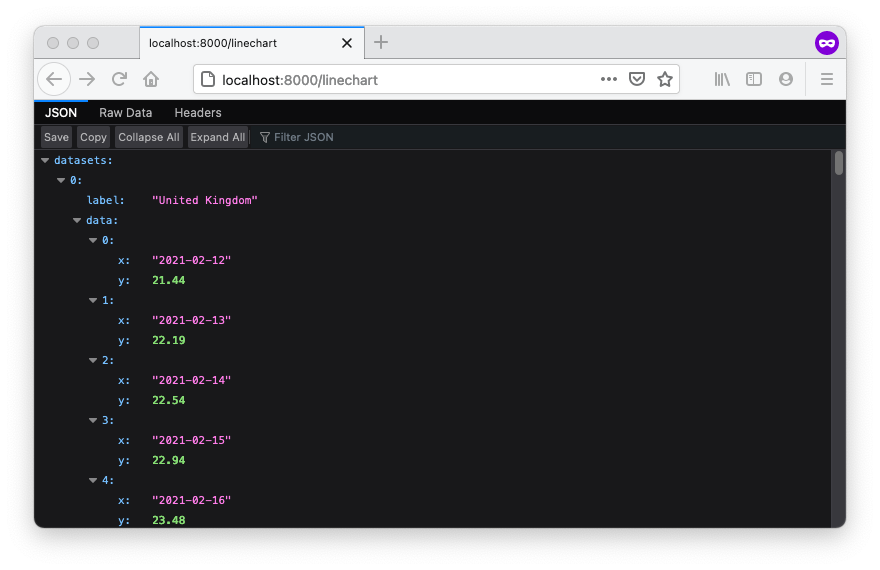
The view linechart is filtering the data to get the entries for a defined list of countries and for the last 2 month. It returns a list of dictionaries, each with a label (the name of the country) and the data (a list of x and y pairs containing date and value).
Note: In a more sophisticated API you would probably make the endpoint accept the list of countries and the time delta as parameters passed with the url.
Let's wire up the view to a url.
# dashboard/urls.py
...

urlpatterns = [
    path('', views.home, name='home'),
    path('linechart', views.linechart, name='linechart'),  # new
]
Enter the url in your browser to test the endpoint. You should see something like this.
Async data fetching with Javascript
Let's start by making a few adjustments to the home.html template.
{% extends 'base.html' %}
{% load static %}
{% block content %}

<h1>Django Dashboardh1>

<h3>People vaccinated per hundredh3>
<div style="height: 400px; width: 500px;">
  <canvas id="myChart" data-url="{% url 'linechart' %}">canvas>
div>

<script
  src="https://cdnjs.cloudflare.com/ajax/libs/Chart.js/3.1.0/chart.min.js"
  integrity="sha512-RGbSeD/jDcZBWNsI1VCvdjcDULuSfWTtIva2ek5FtteXeSjLfXac4kqkDRHVGf1TwsXCAqPTF7/EYITD0/CTqw=="
  crossorigin="anonymous"
>script>
<script src="https://cdn.jsdelivr.net/npm/chartjs-adapter-date-fns@next/dist/chartjs-adapter-date-fns.bundle.min.js">script>
<script src="{% static 'js/charts.js' %}">script>
<script>  // new
  let lineChart = document.getElementById("myChart");
  drawLineChart(lineChart)
script>

{% endblock %}
The canvas element has a new attribute data-url. It contains the url to the data endpoint for this specific chart. You'll also need to include another JavaScript library chartjs-adapter-date-fns, so you can use the time functionality of Chart.js (more info here).
Add reference to the JavaScript file js/charts.js, which I'll cover soon.
In the last script, a reference to the canvas element retrieved using document.getElementById and passed as an argument to the function drawLineChart().
You'll also need to add STATICFILES_DIRS to the settings file, so Django knows where to look for the static files.
# config/settings.py
STATIC_URL = '/static/'
STATICFILES_DIRS = (BASE_DIR / 'static',)  # new
Create a directory js in the static folder and within that directory a a javascript file with the following content.
// static/js/charts.js
const COLORS = [
  "#1170aa",
  "#fc7d0b",
  "#a3acb9",
  "#57606c",
  "#5fa2ce",
  "#c85200",
  "#7b848f",
  "#a3cce9",
  "#ffbc79",
  "#c8d0d9",
];
const BGCOLORS = COLORS.map((c) =>
  Chart.helpers.color(c).alpha(0.5).rgbString()
);

function drawLineChart(canvas) {
  let url = canvas.dataset.url;
  let ctx = canvas.getContext("2d");

  fetch(url)
    .then((response) => response.json())
    .then((data) => {
      new Chart(ctx, {
        type: "line",
        data: {
          datasets: data.datasets.map((dataset, index) => {
            return {
              backgroundColor: BGCOLORS[index],
              borderColor: COLORS[index],
              fill: false,
              ...dataset,
            };
          }),
        },
        options: {
          scales: {
            x: {
              type: "timeseries",
            },
          },
          plugins: {
            legend: {
              position: "bottom",
            },
          },
          responsive: true,
          maintainAspectRatio: false,
        },
      });
    })
    .catch((error) => {
      console.error("Error:", error);
    });
}
The script defines a set of colors and background colors that will be used for the lines of the chart. The colors are from a colorscheme from chartjs-plugin-colorschemes called tableau.ClassicColorBlind10.
Next, a function drawLineChart is defined, which takes a reference to our html canvas element as an argument.
The value of the data-url attribute of of the canvas element is assigned to the variable url. The variable ctx will be needed later when creating the Chart.
To fetch the data asynchronously, JavaScript Fetch API will be used, which is supported by all modern browsers.
fetch() will do a GET request to the data endpoint. Once the response is received it will be transformed into an object by parsing the JSON. Next, a new line chart is created using the Chart.js API. The map function is used to add colors to each dataset. ALso, options are being configured to tell Chart.js to use the x-axis as a time scale and for formatting purposes.
Refresh your browser to see the result.
Conclusion
That's it for this article. To sum things up, you've created a new Django project, defined the data model, created a custom management command to seed the database, created a data endpoint and implemented some JavaScript code that fetches data asynchronously from the endpoint and displays it in a nice chart. Well done!
In the next article, which will be published soon, you'll learn how to add a pie chart to the dashboard, add a data grid to show the most recent vaccination data and add some styling to make it all look nice.
I hope you've enjoyed following along. If you have any questions or feedback let me know in the comments below.